Hello. How can we help you?
-
DEVICE INTEGRATION
- Palo Alto (Device Integration)
- Dell Cylance Endpoint
- McAfee Web Gateway
- Imperva WAF
- Darktrace
- Forescout CounterACT
- Juniper Cortex Threat
- Zscaler
- Sophos
- Sophos Endpoint
- Trend Micro
- Sophos Cyberoam Firewall
- Radware-WAF
- NetScaler WAF
- Ubuntu
- Juniper SRX
- Forcepoint Websense
- FireEye
- Forcepoint DLP
- F5 BIG-IP ASM
- CyberArk PIM
- CheckPoint
- Bluecoat Proxy
- Accops Hyworks
- Barracuda WAF Syslog
- Forwarding F5 Distributed Cloud Services Logs to DNIF over TLS
- JIRA CLOUD
- Aruba ClearPass
- Show Remaining Articles (13) Collapse Articles
-
CONNECTORS
-
- 1Password Connector
- Abnormal Security
- Akamai Netstorage
- Atlassian
- Auth0 Connector
- AWS CloudTrail
- AWS Kinesis
- AWS S3
- AWS S3 (Optimized)
- AWS S3 Optimized Cross Account Connector
- Azure Blob Storage Connector
- Azure Event Hub
- Azure NSG
- Beats
- Box
- Cisco Duo
- Cloudflare Logpull Connector Setup Guide
- CloudWatch Connector
- Cortex XDR
- CrowdStrike
- Cyble Vision
- Device42
- Dropbox Connector
- GCP
- GCP PUB/SUB
- GitHub
- Google Workspace
- Haltdos
- HTTP Connector
- Hub Spot Connector
- Indusface
- Jira Connector
- Microsoft Graph Security API
- Microsoft Intune
- Mimecast
- Netflow
- Netskope Connector
- Network Traffic Analysis
- NextDLP Reveal
- Office 365
- Okta
- OneLogin
- Orca
- PICO Legacy Connector
- Prisma Alerts
- Prisma Incidents
- Salesforce
- Salesforce Pub/Sub Connector
- Shopify Connector
- Slack
- Snowflake
- Snyk Connector
- Syslog
- TCP
- Tenable Vulnerability Management Connector
- TLS
- Trend Micro Audit Logs
- Workday HCM Connector
- Zendesk
- Zoom
- Jumpcloud Connector
- Sophos connector
- Tenable Security Center Connector
- AWS GuardDuty Connector
- Trend Micro Vision One Connector
- RediffMail Pro Connector
- Microsoft Sentinel
- Microsoft Exchange Online Connector
- Show Remaining Articles (53) Collapse Articles
-
-
DATA INGESTION
-
HUNTING WITH WORKBOOKS
-
- Your first FIND with the HYPERCLOUD
- Create a Search Block
- Create a Signal Block
- Create a Text Block
- Create an Outlier Block
- Create a DQL Block
- Create an SQL Block
- Create a Code Block
- Create a Visualisation Block
- Create a Call Block
- Create a Return Block
- Create a Notification Block
- Schedule a Workbook
- Native Workbook
- Workbook Functions
- How to view Workbooks?
- Add Parameters to Workbook
- Working with Pass through Content
- How to create a Workbook?
- Workbooks
- Show Remaining Articles (5) Collapse Articles
-
-
DNIF Query Language (DQL Language)
-
SECURITY MONITORING
- Streamline Alert Analysis with Signal Tagging
- Workbook Versioning: Track, Collaborate, and Restore with Ease
- What is Security Monitoring?
- Creating Signal Suppression Rules
- Why EBA
- Signal Suppression Rule
-
- What are signals?
- View Signal Context Details
- Suspect & Target
- Source Stream
- Signal Filters
- Signal Data export
- Signal Context Details
- Signal Confidence Levels
- Raise and View Signals
- Investigate Anywhere
- How to add a signal to a case?
- Graph View for Signals
- Global Signals
- False Positives
- Add Multiple Signals to a Case
- Add comment to the signal
- Show Remaining Articles (1) Collapse Articles
-
OPERATIONS
-
MANAGE DASHBOARDS
-
MANAGE REPORTS
-
USER MANAGEMENT & ACCESS CONTROL
-
BILLING
-
MANAGING YOUR COMPONENTS
-
GETTING STARTED
-
INSTALLATION
-
SOLUTION DESIGN
-
AUTOMATION
-
- Active Directory
- AlienVault
- Asset Store
- ClickSend
- Domain Tools
- Fortigate
- GreenSnow
- JiraServiceDesk
- Microsoft Teams Channel
- New Relic
- Opsgenie
- PagerDuty
- Palo Alto
- ServiceNow
- Slack Configuration
- TAXII
- Trend Micro
- URLhaus
- User Store
- Virustotal
- Webhook
- Show Remaining Articles (6) Collapse Articles
-
-
TROUBLESHOOTING AND DEBUGGING
-
- TLS ( Troubleshooting Procedure)
- TCP (Troubleshooting Procedure)
- Syslog (Troubleshooting Procedure)
- Salesforce ( Troubleshooting Procedure)
- PICO
- Office 365 (Troubleshooting Procedure)
- GSuite
- GCP (Troubleshooting Procedure)
- Beats (Troubleshooting Procedure)
- Azure NSG ( Troubleshooting Procedure)
- Azure Eventhub
- AWS S3 (Troubleshooting Procedure)
-
-
LICENSE MANAGEMENT
-
RELEASE NOTES
- May 6, 2026 - Content Update
- March 31, 2026 - Content Update
- March 16, 2026 - Application Update
- February 26, 2026 - Content Update
- January 19,2026 - Content Update
- December 23, 2025 - Application Update
- December 4,2025 - Content Update
- November 27, 2025 - Application Update
- October 28, 2025 - Content Update
- August 20, 2025 - Content Update
- August 5, 2025 - Application Update
- July 15, 2025 - Content Update
- June 13, 2025 - Content Update
- May 21, 2025 - Content Update
- April 17, 2025- Content Update
- March 25, 2025- Content Update
- March 18, 2025 - Application Update
- March 5, 2025 - Application Update
- January 27, 2025 - Application Update
- January 29, 2025 - Content update
- December 30, 2024 - Content Update
- December 12, 2024 - Content Update
- December 3, 2024 - Application Update
- November 15, 2024 - Content Update
- October 26, 2024- Application Update
- October 23, 2024 - Content Update
- October 16, 2024 - Application Update
- September 04, 2024 - Application Update
- September 04, 2024 - Content Update
- August 27, 2024 - Application Update
- July 30, 2024 - Application Update
- June 04, 2024- Application Update
- April 24, 2024- Application Update
- March 26, 2024 - Application Update
- February 19, 2024 - Application Update
- January 09, 2024 - Content Update
- January 09, 2024 - Application Update
- November 27, 2023 - Content Update
- November 27, 2023 - Application Update
- October 05, 2023 - Application Update (Release Notes v9.3.3)
- May 30, 2023 - Application Update (Release Notes v9.3.2)
- November 29, 2022 - Application Update (Release Notes v9.3.0)
- Show Remaining Articles (27) Collapse Articles
-
API
-
POLICIES
-
SECURITY BULLETINS
-
BEST PRACTICES
-
DNIF AI
-
DNIF LEGAL AND SECURITY COMPLIANCE
View Cases
Case Listing Page
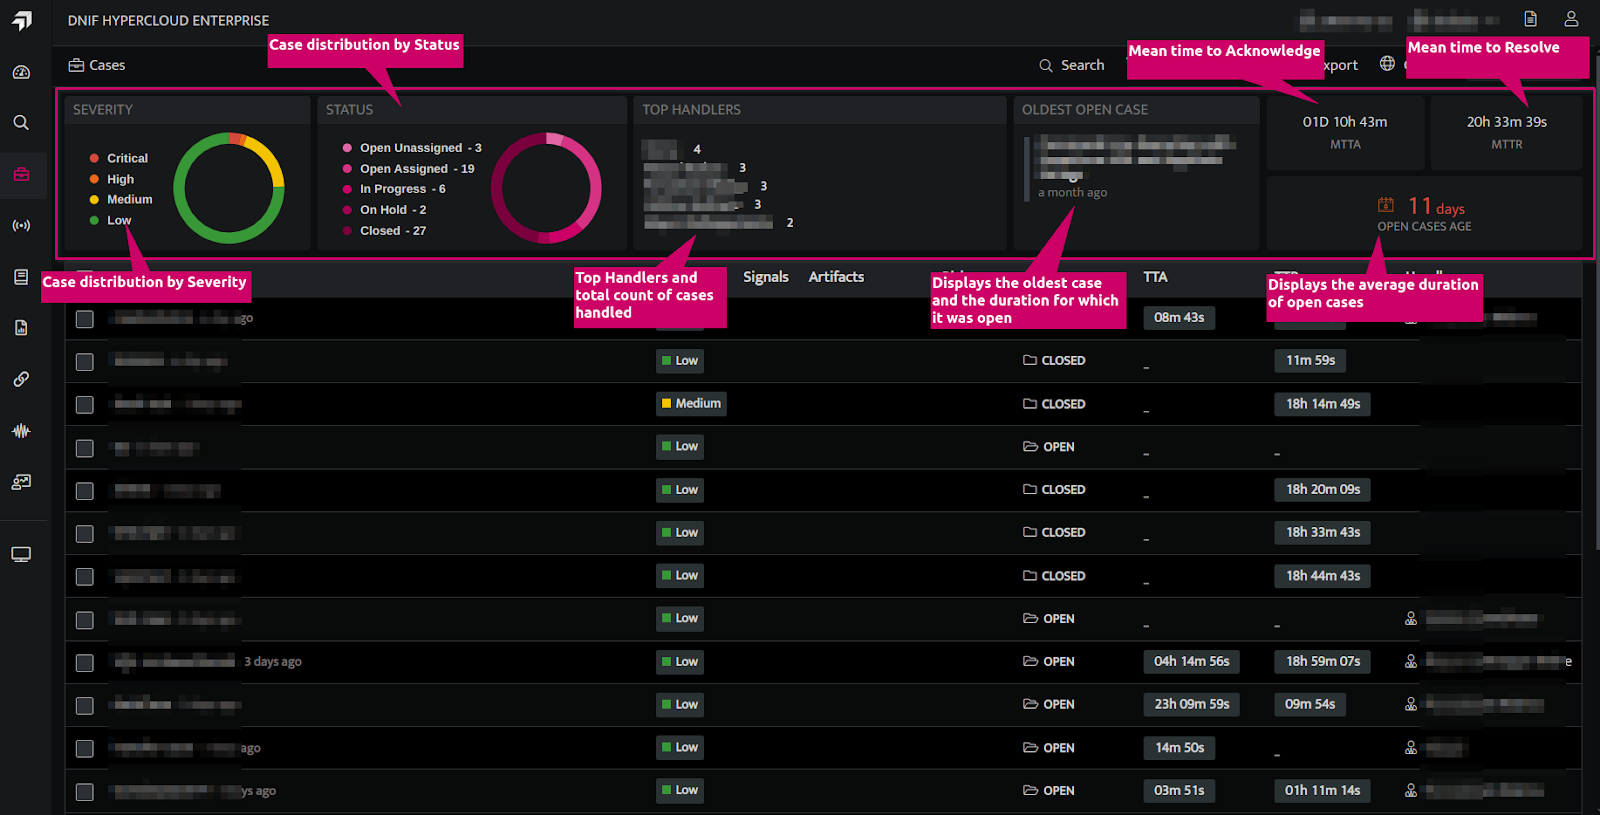
- On the left navigation bar, Click the Cases icon to view the cases listing page.
- The top section of the case listing page showcases essential case statistics, including the distribution of cases by severity levels and status values. It also highlights the top handlers, details about the oldest open case, average duration of open cases, MTTA and MTTR values.
| Fields | Description |
| Severity | Displays the distribution of cases by severity levels: Critical High Medium Low |
| Status | Displays the distribution of cases by status values: Open Unassigned Open Assigned In-Progress On-HoldClosed |
| Top Handlers | Lists the top handlers along with the count of cases assigned to each. |
| Oldest open case | Shows the oldest open case along with the duration it has been open. |
| Mean Time To Acknowledge (MTTA) | Displays the average time taken to acknowledge a security alert after it has been generated |
| Mean time to resolution (MTTR) | Displays the average time taken to fully resolve a security incident starting from when it was acknowledged. |
| Open cases age | Displays the average duration of open cases. |
- The table below the top section displays all cases, sorted with the most recent case at the top.
- A case has the following attributes:
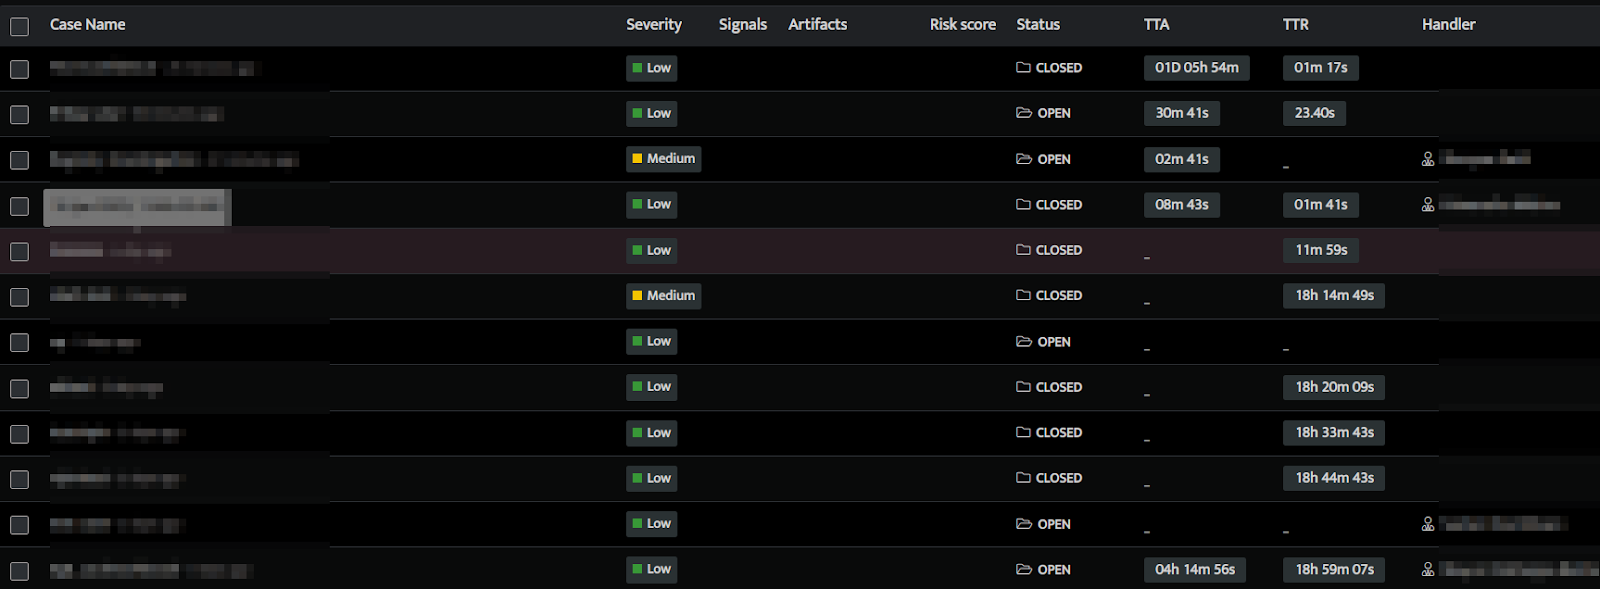
| Fields | Description |
| Created Time | The time at which the case was created |
| Case Name | A descriptive title summarizing the nature of the case |
| Severity | Indicates the severity or importance (e.g., Low, Medium, High, Critical). |
| Signals | Signals associated with the Case |
| Artifacts | The evidence gathered in Signals associated with the case i.e. the Suspect and Target objects that should be investigated. |
| Risk score | The sum of the detection scores of all Signals associated with the Case. |
| Status | Current state of the case (e.g. Open, In-Progress, On-Hold, Closed). |
| Notes | Details of the actions performed on the case and notes captured by users. |
| Time to Acknowledge | The time taken to Acknowledge a security alert after it has been generated. |
| Time to Resolve | The time taken to fully resolve a security incident starting from when it was acknowledged. |
| Handler | The investigator responsible for handling the case. |
- Global Cases provides a consolidated view of all cases across Tenants and Scopes, accessible to users with the appropriate permissions.
Note: Tenants were previously referred to as Clusters.
View Case Details
- On the Case listing page, click on a case to view its details. The following screen is displayed.
- The top bar displays the name, the handler, severity level and status of the case.

- The Signals tab displays the list of all signals associated with the selected case. The following details are displayed on this tab:
- Name of the signal
- Date and time of the signal
- Technique and tactic of the signal
- Target / Suspect Host IP Address
- Graphical view of signals
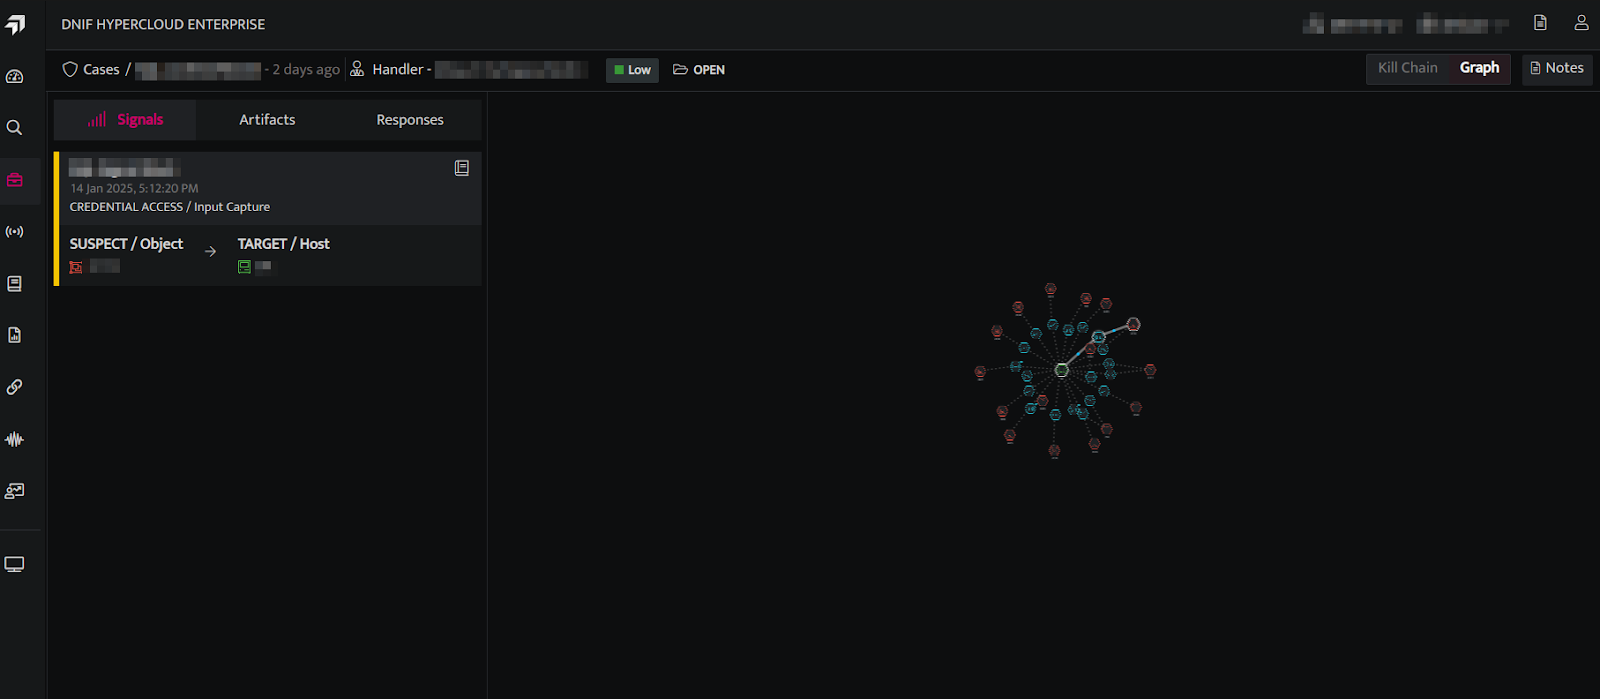
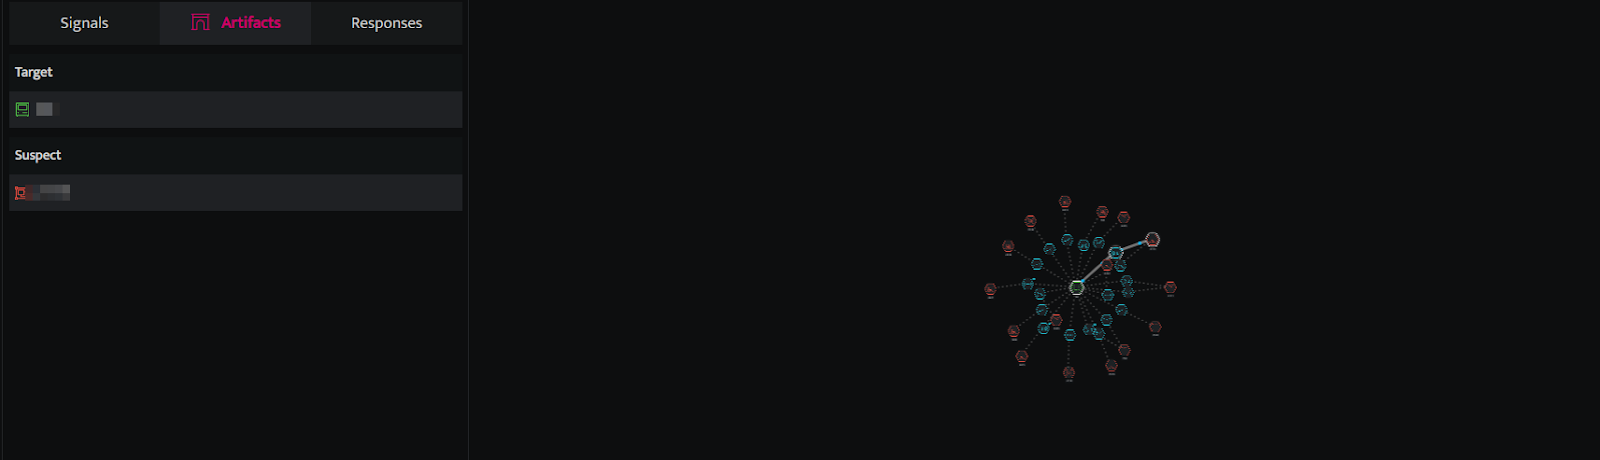
- The following entities can be identified from the Graph
- The targets
- The suspects
- Compromised users
- All the concurrent connections that were accessed by the particular compromised user.
- The different anomalies detected – Authentication anomalies / User location anomalies.
- The Artifacts tab displays the evidence gathered in Signals associated with the case i.e. all the Suspect and Target objects, identified in Signals associated with the case, that should be investigated. For further investigation refer to the Investigate Anywhere doc.
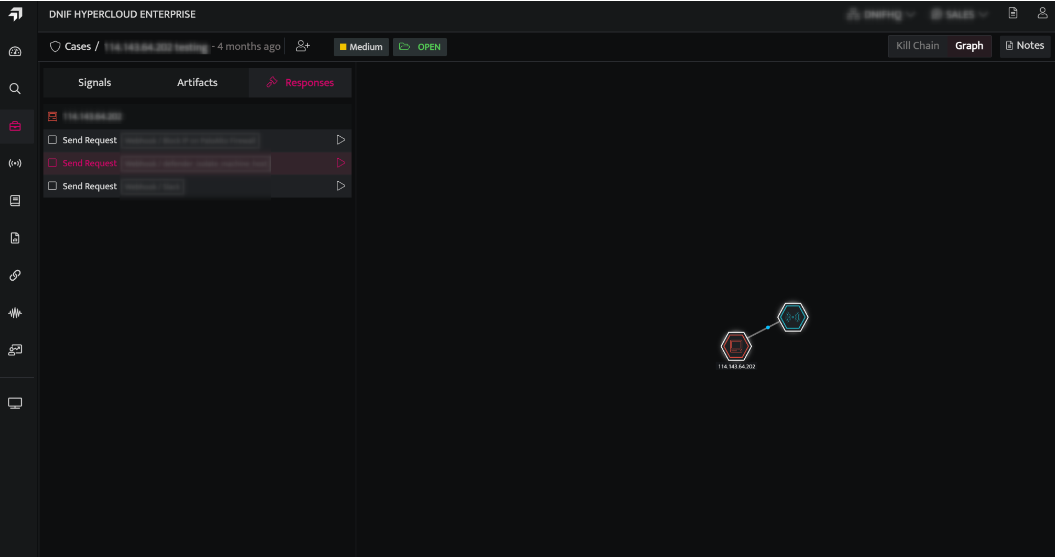
- The Responses tab displays the list of all the Suspect and Target objects, identified in Signals associated with the case. It also allows the user to respond to each object.