This section helps you to manage and monitor the services of PICO.
How to view PICO Services?
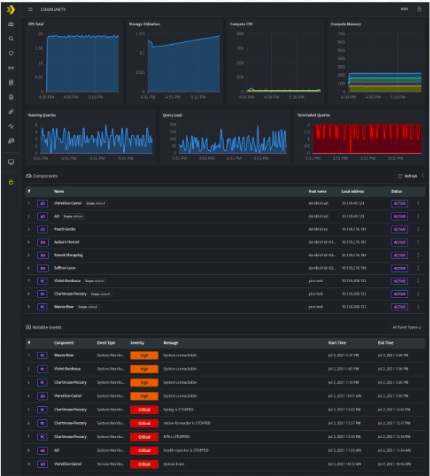
- Hover on the Administration icon on the left sidebar of the Home screen, from the option displayed select Manage Components, the following screen will be displayed.

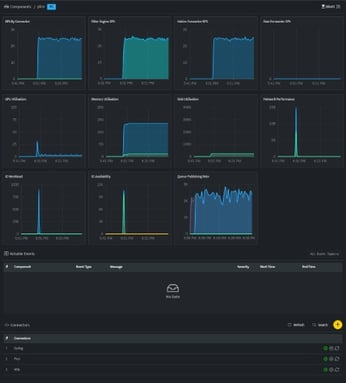
- Click the Component name to view the Health page of that particular Component.

- Services can be managed using the Manage icon displayed on the top right corner of the PICO Health screen.
You can edit the name of the component on the top left corner of the screen using the Edit icon and then click Save, to save the component name.
| Icon | Description |
| Click this icon to list the services of the PICO component. Each service listed can be enabled/disabled. | |
| Indicates that the services is up and running | |
| Indicates that the particular service is stopped | |
| Click this to restart the service |
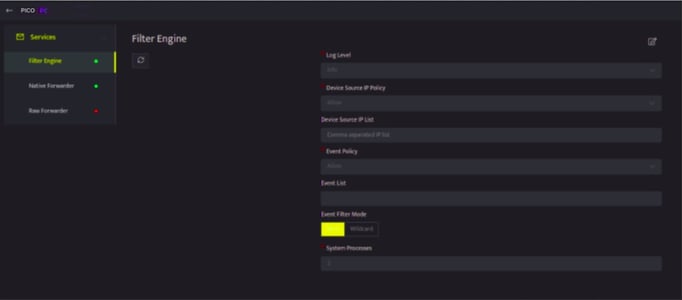
PICO services can be individually restarted from the following screen

The PICO component displays the following services:
| Field Name |
Description |
| Filter Engine |
Log Level: Used to know the status of the logs updated before forwarding to the next queue.The logging level can be set with below integer values:
Device Source IP Policy: The valid values are:
Device Source IP List: Enter the list of host IP addresses of the devices from which log forwarding should be allowed or denied. Event Policy: The valid values are:
|
| Native Forwarder |
Log Level: Used to know the status of the logs updated before forwarding to the next queue.The logging level can be set with below integer values:
Scope: Lists all the scopes available in the tenant (previously known as cluster), select to assign PICO to a particular scope Primary Adapter(s): Select the IP address of the primary Adapter to which the filtered logs will be forwarded. Failover Adapter(s): Select the IP address of the failover Adapter to which the filtered logs will be forwarded. System Processes: The number of services or instances running in multiple Native Forwarders. The more the number of processes, the better is the performance of filtering. The minimum value is 1. |
| Raw Forwarder | Log Level: Used to know the status of the logs updated before forwarding to the next queue. The logging level can be set with below integer values:
Destination IP: Enter an IP address to forward logs through Raw Forwarder. Spoof Mode: Select True or False. This is used to spoof the IP address from the source. System Processes: The number of services or instances running in multiple Raw Forwarders. The more the number of processes, the better is the performance of filtering. The minimum value is 1. |
