- KNOWLEDGE BASE
- SECURITY MONITORING
- INVESTIGATE SIGNALS
-
START YOUR TRIAL
-
DEVICE INTEGRATION
-
CONNECTORS
-
DATA INGESTION
-
HUNTING WITH WORKBOOKS
-
DNIF Query Language (DQL Language)
-
SECURITY MONITORING
-
OPERATIONS
-
MANAGE DASHBOARDS
-
MANAGE REPORTS
-
USER MANAGEMENT & ACCESS CONTROL
-
BILLING
-
MANAGING YOUR COMPONENTS
-
GETTING STARTED
-
INSTALLATION
-
SOLUTION DESIGN
-
AUTOMATION
-
TROUBLESHOOTING AND DEBUGGING
-
LICENSE MANAGEMENT
-
RELEASE NOTES
-
API
-
POLICIES
-
SECURITY BULLETINS
-
BEST PRACTICES
-
DNIF AI
-
DNIF LEGAL AND SECURITY COMPLIANCE
Raise and View Signals
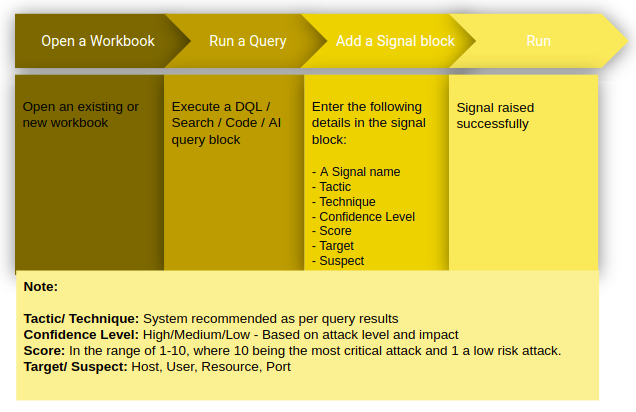
You can raise a signal from the workbook by adding a Signal block.

On executing the following query you can view whether a signal has been raised or not.
_fetch * from event where $Stream=SIGNALS limit 10
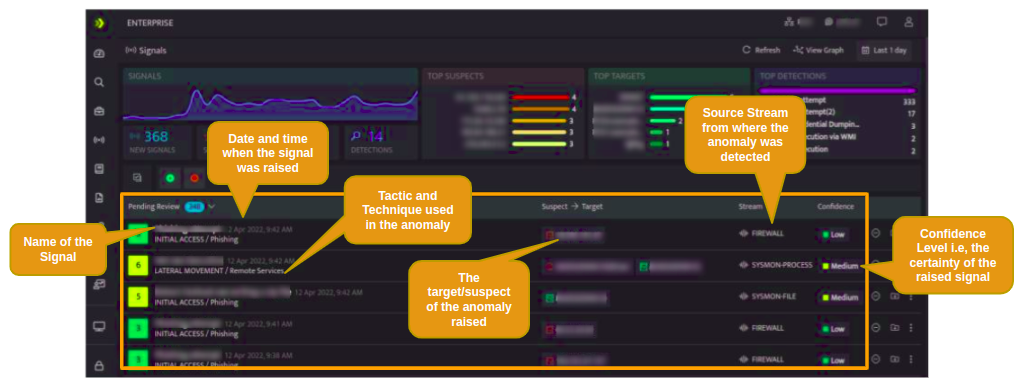
The signals icon on the left navigation bar will allow you to view all the signals raised in the tenant (previously known as cluster).

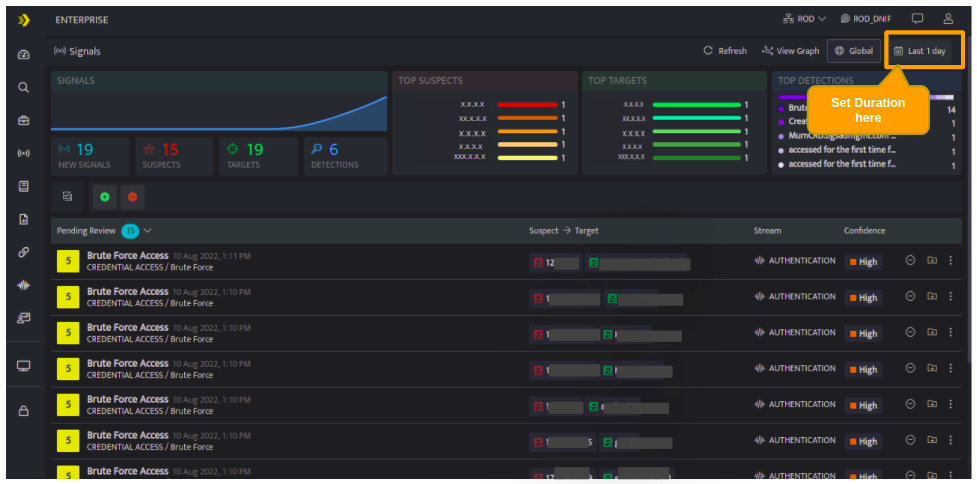
Duration
You can always view signals based on the duration when it was raised.

You can select the following time ranges as per your requirement.
- Quick Select: In this category you can enter any number and set to retrieve the data for that many minutes/hours or days.
- Presets: Lists all the available preset options.
- Date Range: Select a custom date and time range from the calendar.
- The following are the list of available options under Quick Select and Preset.
- Last 5 minutes: Displays signals raised during the last 5 minutes
- Last 30 minute: Displays signals raised during the last thirty minutes
- Last one hour: Displays signals raised during the last one hour.
- Last one day (default value): Displays signals raised during the last one day.
- Last one week: Displays signals raised during the last week
- Last one month: Displays signals raised during the last one month
