Network traffic analysis (NTA) is a method of monitoring network availability and activity to identify anomalies, including security and operational issues. Common use cases for NTA include:
- Collecting a real-time and historical record of what’s happening on your network.
- Troubleshooting a slow network
- Improving internal visibility and eliminating blind spots
The NTA Connector is used to gain an insight into all the traffic flowing through the setup network and fetch logs for different protocols, connections, etc. while listening on a particular network interface of the host system on which it is deployed. These include all HTTP sessions with their requested URIs, key headers, MIME types, and server responses; DNS requests with replies; SSL certificates; key content of SMTP sessions; and much more.
By default, the Syslog traffic and the Connection traffic on the host system where the connector is deployed is filtered out to reduce noise in the log collection. This helps to capture events for critical protocols for network security monitoring.
Configurations
Benefits of NTA
- Improved visibility into devices connecting to your network (e.g. IoT devices, healthcare visitors)
- Meet compliance requirements
- Troubleshoot operational and security issues
- Respond to investigations faster with rich detail and additional network context
Configurations
The following are the configurations to fetch Network Traffic logs on DNIF.
- Follow the initial configuration steps in Connector Configurations.

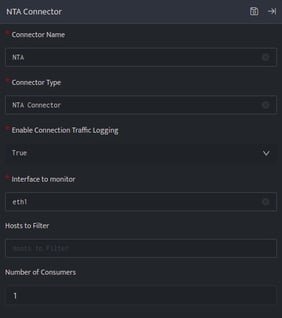
- Click edit icon on the above screen and enter the following details.
Field Name Description Connector Name Enter a name for the connector Connector Type Enter NTA connector Enable Connection Logging Enable connection logs generated on host system Interface to Monitor Network Interface on host to monitor network traffic Hosts to Filter List of Hosts to filter network traffic to and from particular hosts Number of Consumers Number of consumer processes to run for the network traffic log consumption - Enter the above details and click Save.
Once the connector is configured, validate if the connector is listed under Collection Status screen with status as Active. This signifies the connector is configured successfully and data is ready to ingest.
