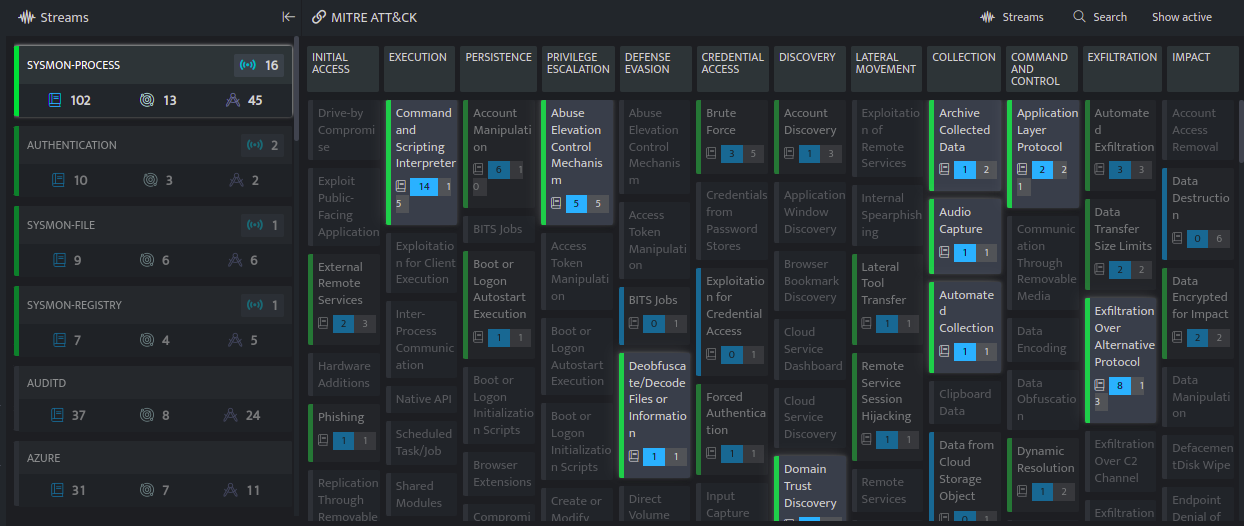
- On the MITRE ATT&CK® page, the streams option is displayed on the top right corner of the screen.
-png.png)
- Click the streams option on the right side of the top bar, a panel will be displayed as follows:
-png.png)
The panel displays all the streams available in the workbook, each stream displays the following details:
-png.png)
|
Indication |
Description |
|
Green vertical bar |
This indicates that there are active incoming signals for this stream |
|
Blue vertical bar |
This indicates that there are no active signals but logs are available for this stream. |
|
Light Grey vertical bar |
This indicates there are no active workbooks but logs are available for this stream |
|
Dark grey vertical bar |
This indicates there are no active signals and logs are also not available for this stream. |
-png.png)
|
Indication |
Description |
|
|
Displays the log size of the particular stream |
|
|
Displays the number of workbook associated with this particular stream |
|
|
Displays the number of tactics involved |
|
|
Displays the number of techniques used |
|
|
Displays the number of active signals |
|
|
Displays the timeline graph for that particular stream related to signals |
- Click the stream and it will automatically highlight all the workbooks that has the selected stream under each tactic

- The green bar next to the technique indicates that there are workbooks with active signals and the blue bar indicates that there are no active signals.

-png.png)


-png.png)