Outlier accelerates and automates the process of identifying a potential threat. It would allow you to investigate and diagnose the specific entity responsible for the suspicious activity. You can automate the process by adding the identified incident as a signal. DNIF also uses a data-driven approach to identify patterns exhibited by the majority of the data and highlights data points that deviate from these patterns. An outlier is an observation which deviates so much from the other observations as to arouse suspicions that it was generated by a different mechanism.
How to add an Outlier block?
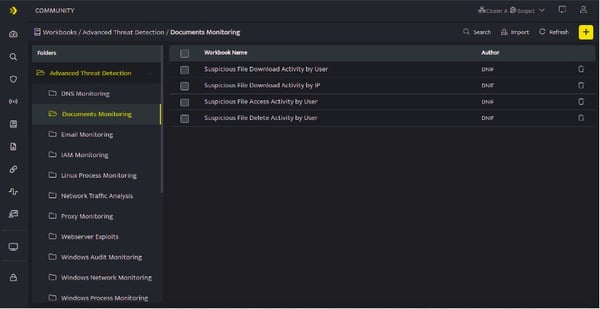
- Hover on the Workbooks icon on the left navigation bar, it will display the folder wise view of existing workbooks in the tenant (previously known as cluster).

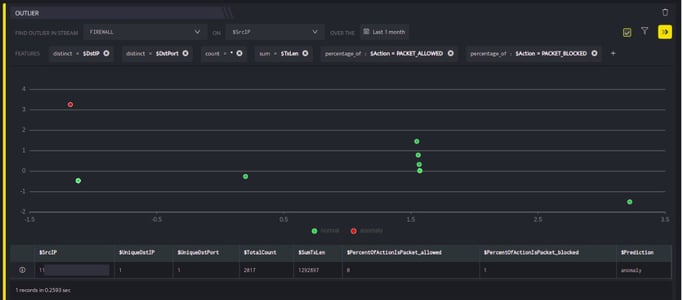
- Click plus icon on the Workbook page and select Outlier Block from the list, the following screen will be displayed.
Outlier Block

This is an independent block i.e. the output obtained is not dependent on the result of any other block. You can add this block along with other blocks in the workbook.
- Enter the details in the fields as explained below:
| Field |
Description |
| FIND OUTLIER IN STREAM |
Select the entity for which you want to detect the outlier. Note: The features are auto recommended based on the Entity selection, these features will act as filters to narrow down the outlier hunt. |
| ON | Select the stream for which you to detect the outlier |
| OVER THE | It will allow you to select a time range based on your requirement.
|
| FEATURES | This will be displayed on the basis of the Stream selected, you can also add additional features as per your requirement. |
| Used to filter the features to be displayed in the grid and graph. | |
| Used to view only anomalies, this checkbox is selected by default, un-check this checkbox to view normal users along with anomalies |
- Click Run after selecting the required parameters, the outliers detected will be displayed in a grid and graph format.

-
The list of anomalies detected are listed in the grid. It will display all the anomalies along with all the features that were selected for the particular outlier entity and the same anomalies will be indicated as a red dot in the scatterplot.
-
The anomalies detected can be considered as a security incident and you can raise a signal. To raise a signal refer to the steps in the Create a Signal Block document.
-
For more details on details on Workbooks, refer Create a Workbook
